


Full moons have been known throughout human history to cause shifts in energy, often interrupting people's normal sleep patterns and changing moods and behaviors of all living things. Full moons occur when the Sun and the Moon are aligned on opposite sides of Earth, and 100% of the Moon's face is illuminated by the Sun. Therefore, it makes sense that full Moons hold a unique energy that affects us all; nearly all of our energy on Earth is generated from the Sun and the gravitational pull of the Moon causes rises and falls in ocean/sea levels. Everything is intertwined, and the Sun and Moon are at the foundation of what moves us all.
Our moods are affected by the Sun and Moon, and Full Moons often create more intense energetic experiences in human beings. Thus, it makes sense that Full Moons could also have an effect on financial markets, sometimes marking the beginning or end of market cycles. When I first read about the theory of Full Moons and market cycles I immediately dismissed it as being a crackpot hocus pocus theory that made no sense. However, as I have become a more experienced market participant/observer, and a little bit wiser human being over the years, I have begun to respect this theory. Mind you, that doesn't mean that I think every Full Moon is especially notable for markets, or that I base my trading/investing decisions on Full Moons. What it does mean is that I do pay attention to market conditions leading up to a Full Moon, and I add extra weight to big market moves or trend changes that occur at/near Full Moons.
That brings us to today and the Harvest Moon of 2021. The Harvest Moon is the final Full Moon of summer and marks the beginning of fall. One could say that the Harvest Moon lets us know that winter is coming. Today's Full Moon market action is notable on many levels, however, there are two aspects of the daily chart of the S&P 500 that really stand out to me:
SPY (Daily)

Not only is the S&P 500 down 2.2% on a Full Moon, today's big decline began with an opening gap lower. Moreover, this gap lower "gapped through" the 50-day moving average. This morning's gap lower and the subsequent candlestick stand out on the above chart - you don't need to be a master technical analyst to see that today's trading session stands out on the chart.
Moving averages are moving targets, not exact support/resistance levels. Moving averages can serve as important tools that illustrate market trends, and the 50-day/200-day simple moving averages (SMAs) are widely followed by technicians and most market participants. In the above SPY chart you can see that the SPY 50-day moving average has closely marked pullback lows since the beginning of the year. In fact, a blind monkey could have traded the stock market better than 99% of market participants by simply buying the SPY every time it dipped back to touch its 50-day SMA and then taking profits a week or two later.
Of course, hindsight is 20/20 and anyone can look at a chart of the past and tell how you should have traded the market in question. The notable aspect of today's big gap lower and market sell-off is that market participants are exhibiting a change of character; they aren't buying the dip hand over fist, and barring a miraculous turnaround in the final hour of trading SPY has decisively closed below the 50-day SMA. In addition, the fact that the SPY gapped through the 50-day without actually testing it during US trading hours adds a more bearish element to today's decline. From my nearly 20 years of trading experience I have learned that technical resolutions that occur by way of opening gap tend to carry more weight, and often result in stronger trending moves. Perhaps because they are a bit rarer, and the opening gap in itself denotes a market that is becoming more imbalanced.
I don't need to post a dozen charts to state that there so many charts with completed topping patterns out there that I can't keep track of all of them. This market is on shaky ground, and I'm probably understating things by saying that.
Where does one hide?
It's not a secret that I'm bullish on gold long term. However, I have to agree with 321gold founder Bob Moriarty's assessment that "gold and silver are about to have their day". Evergrande is creating a liquidity crisis in China's financial markets, and we know that there is never just one cockroach. This crisis is occurring against an already shaky backdrop and a steeply decelerating G3 credit impulse:

Considering the last three times the above chart reached the current level of negative credit impulse it resulted in extreme central bank easing, it's hard to imagine a hard taper is coming from the Fed in the next few months. Toss in the Evergrande/China turmoil and the latest US monthly jobs data and it's even more difficult to envision the Fed announcing the start of a tapering process this week.
While anything can happen in markets in the short term, we know what the endgame is whenever there is a liquidity crisis and market turmoil - central banks throttle the liquidity spigots into overdrive, governments orchestrate bail-outs, and the market's worst fears gradually abate.
When I overlay the current macro backdrop (US debt ceiling, sharply slowing US economic recovery, China property bubble etc.) with the current extreme bearish sentiment on precious metals (Daily Sentiment Index reading of 10 for both gold & silver, and 0% of gold miners trading above their respective 200-day moving averages) and I've seldom seen a more promising bullish setup in gold:
Gold (Daily)
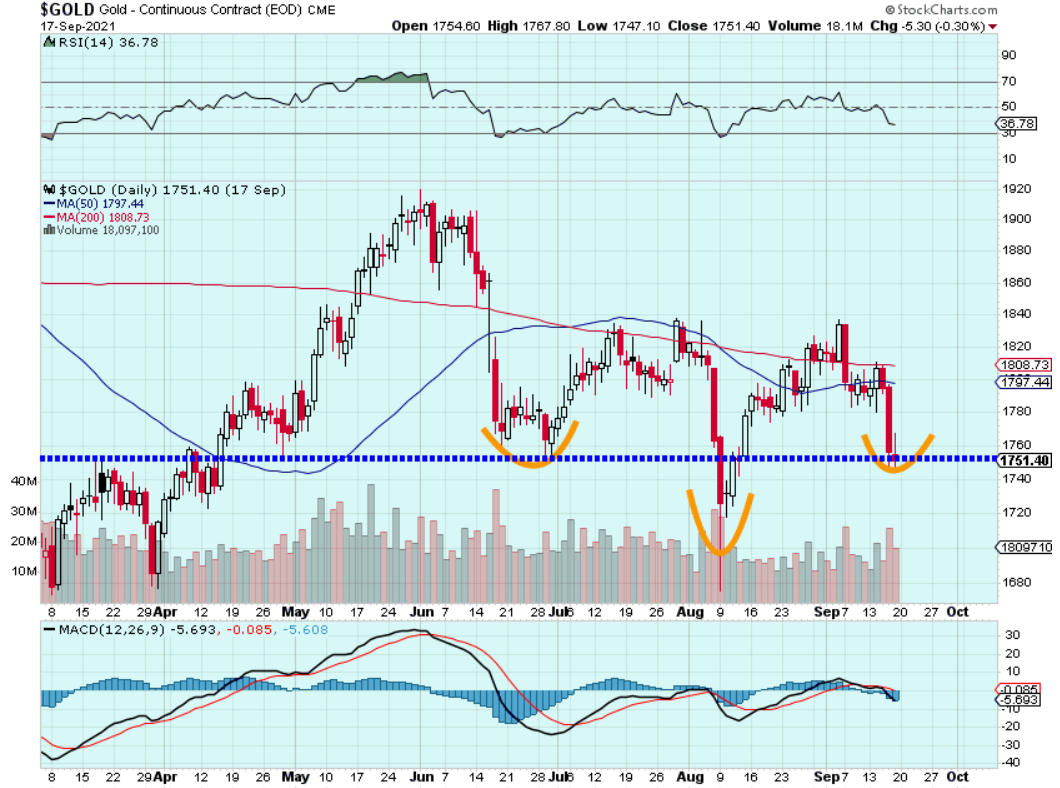
So far gold has held support at $1750 on a closing basis and the potential exists for a multi-month head & shoulders bottom to reach fruition (with a breakout above $1840 this pattern would be completed and potentially target $2,000+). For now gold bulls can gain some small comfort in the fact that last week's gold market smackdown made a higher low (relative to August's $1677 low) and support at $1750 held despite the fact that sentiment couldn't have been much more putrid.
