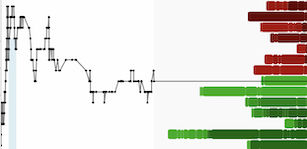
In the last few weeks, the US equity market has entered a full-fledged correction. Meanwhile, money continues to flow into hard assets like copper, gold, and silver. Other commodities such as oil, corn, and lumber have not been able to keep pace with the metals. In particular, lumber has entered a tailspin:
Lumber (Daily)

The dreadful lumber performance matches up well with the performance of construction and home improvement stocks such as HD and LOW.
Since the beginning of April, the S&P 500 is down a little less than 6%. However, as usual the market leading index is covering up a significant amount of damage beneath the surface.
SPY (Daily)

During Q1, former market leaders such as Home Depot (-15% since end of March), Apple (-14% YTD), and Tesla (-40% YTD) have all been shot down.
TSLA (Daily)

Up until this week, tech heavyweights such as Nvidia and Amazon had remained impervious to the downtrends forming across other stocks and sectors. However, that all changed in a big way today with NVDA falling 10% and shedding ~$200 billion in market cap in the process:
NVDA (Daily)

After today’s bloodshed, NVDA’s March double-top looms ominous overhead. It appears that in investors’ eyes the AI miracle is on hold, at least for now. With the Fed now likely to hold rates at current levels until at least September, it seems that a combination of hot CPI data and Fed jawboning has finally managed to convince markets that rate cuts are not imminent.
Resetting of rate cut expectations has served to kill the sugar buzz that equities were riding high on throughout Q1.
While tech got wrecked, money has begun to trickle into metals and even some select mining shares.
AEM (Daily)

The premier senior gold producer, Agnico Eagle (NYSE:AEM), finished the week with back-to-back 52-week high closes.
Gold’s relentless ascent is beginning to catch some headlines, but one would never know by looking at $900 million of net outflows from ETFs and mutual funds in the last two weeks. Even with little investor interest in North America, gold managed to make another new weekly all-time closing high this week, its first ever weekly close above $2,400/oz:
Gold (Weekly)

With the Fed trapped during a heated election year, and a Fed policy error becoming increasingly likely, it’s beginning to feel like the mid-1970s all over again:

The parallels to 1976 are striking; ‘76 was an election year in which the Fed made a famous policy error, allowing inflation to run hot for the next several years. Gold’s performance from the end of 1976 until January 1980 was one for the history books with a nearly 800% return.

Strong emerging market central bank buying, Chinese consumer demand, and the potential for Asian currency devaluations only add turbo boosters to what is already a structural bull market in gold.
Turning to the gold daily chart I continue to be impressed by its resilience around the $2,400 level, working off last Friday’s overbought condition primarily through time:
Gold (Daily)

Meanwhile, silver caught an upgrade from Citi Research with a note calling for $31.00/oz silver in 2025:
“We upgrade our base case NY silver price forecasts for 2024 (12%) and 2025 (19%) to $29/oz and $31/oz, respectively. This is consistent with the bull case scenario from our 2Q Commodities Outlook and our 0-3m and 6-12m target price updates on 5 April. While gold has reemerged as an alternative-fiat, physical demand, and macro hedge play, silver seems more of a catch-up trade and driven by financial momentum.
The mid-1Q to early 2Q decline in the gold/silver (XAUXAG) ratio from ~90-92x to ~83-85x also suggests that investors are more optimistic about a soft-landing scenario versus US recession. To the extent the Fed proceeds with insurance cuts and growth stays strong in 2H’24, we could see XAUXAG push lower to ~70x. On the other hand, if investors have mispriced the risk of weaker GDP growth and higher UE rates in the US, the gold/silver ratio could spike to ~95x.”
Silver (Weekly)

Silver continues to consolidate above previous resistance near $28/oz and it just quietly made its highest weekly close in more than a decade.
Everyone knows the $30 level is the big nut to crack, a level that silver has failed to breach on multiple occasions since 2020. However, it seems to me quite likely that silver will at least match Citi’s $31 target level by the end of this year. With significant potential for an overshoot as high as $35/oz (70x gold/silver ratio with $2450 gold = $35 silver).
Last but certainly not least, copper has been a terrific performer so far in April, rising more than 10%:
Copper (Weekly)

At a recent conference, Goldman Sachs analysts delivered a memorable line stating that copper is in “the foothills of what will be its Everest”:
"Funds have driven copper up to ~$9,500/t (+~20% since late November), on early signs of global reflation and in anticipation of physical deficits. Pure-play copper equities, which are even more forward-looking, have moved up to a price of $10.5k-12.5k/t copper into perpetuity, suggesting that there is further room for forward-looking investors to take the commodity price higher. Indeed, pure-play equity-implied copper prices are consistent with our view that we have entered the second secular copper bull market this century. Likely LME withdrawals of Russian metal and modest deficits should support prices around current levels over the next 3 months. We still see a path up to $15k/t by 2026 in our bull-case scenario."
FCX (Daily)

Weak copper mine supply growth and Russian sanctions in combination with increasing demand from EVs, infrastructure buildouts (power grid, data centers, solar farms, high-speed rail etc.), and China economic stimulus has created a perfect storm for a rising copper price in 2024.
Welcome to the Metalsverse, we’re just getting started!
DISCLAIMER: The work included in this article is based on current events, technical charts, company news releases, corporate presentations and the author’s opinions. It may contain errors, and you shouldn’t make any investment decision based solely on what you read here. This publication contains forward-looking statements, including but not limited to comments regarding predictions and projections. Forward-looking statements address future events and conditions and therefore involve inherent risks and uncertainties. Actual results may differ materially from those currently anticipated in such statements. This video is provided for informational and entertainment purposes only and is not a recommendation to buy or sell any security. Always thoroughly do your own due diligence and talk to a licensed investment adviser prior to making any investment decisions. Junior resource companies can easily lose 100% of their value so read company profiles on www.SEDAR.com for important risk disclosures. It’s your money and your responsibility.


